
Kubernetes, Kops, Logging and Monitoring
TL;DR
To quickly setup kubernetes and monitoring using kops, follow my example github repository.
Background
Recently, i am helping our client move their applications to containerized microservices.
Moving to docker containers provide many benefits. However, docker alone does not allow us to orchestrate our containers in productions. To solve that problem, we need a container platform/orchestrator technology. We adopted kubernetes as our containers orchestrator of choice. Kubernetes allow us to horizontally scale our microservices across nodes to provide highly availablility and scalability.
In this post, i would like to document how we are explored the various orchestrator options and how we are running kubernetes in production.
KOPS ( Kubernetes Operation)
There are various ways to operate a kubernetes clusters and it can range from being really complex to simple hosted cloud solutions.
These are some of the various tools and platforms:
- Kops ( run on aws )
- Openshift
- Google container engine ( google cloud )
- Jujucharms, canonical distribution of kubernetes ( baremetal, metal cloud ( Machine as a service ), virtual machines )
- Kubeadm ( baremetal, virtual machines )
- More..
After evaluating the various options, we decided with kops which will provision our cluster on aws. We found kops to be the most robust and it works seamlessly for us. Using kops we get multi-az nodes deployment and auto scaling group at the cluster level. On top of it, our client is already on aws platform. kops project has a strong community behind it.
Learn more about kops here
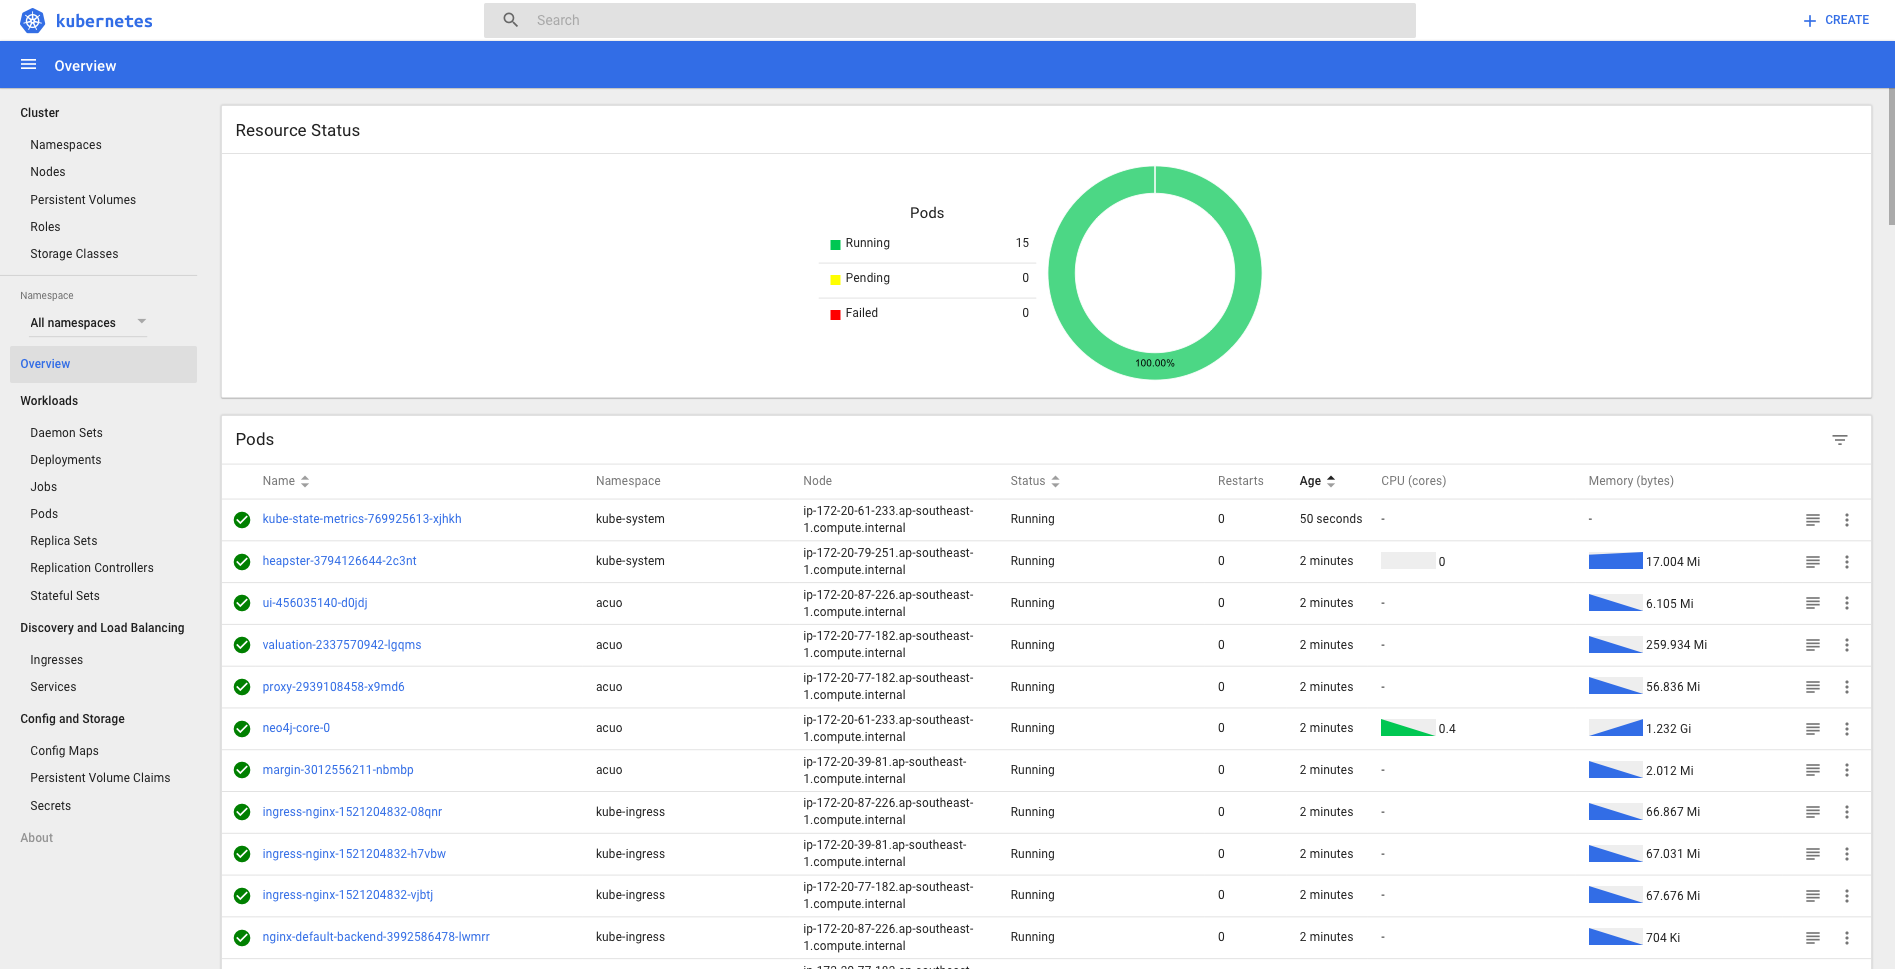
Kubernetes Dashboard
The first deployment to run in kubernetes is the kubernetes dashboard. Running kubernetes dashboard allow us to visualize what kubernetes resources are running or getting scheduled, destroyed. It also shows quickly let us know if there is any errors in the cluster.
Datastore
We run elasticsearch outside of kubernetes to store log data generated by fluentd and metricbeat daemonsets. Running ELK outside kubernetes is more robust, in case kubernetes clusters goes down, we can still see logs on what happened before kubernetes died.
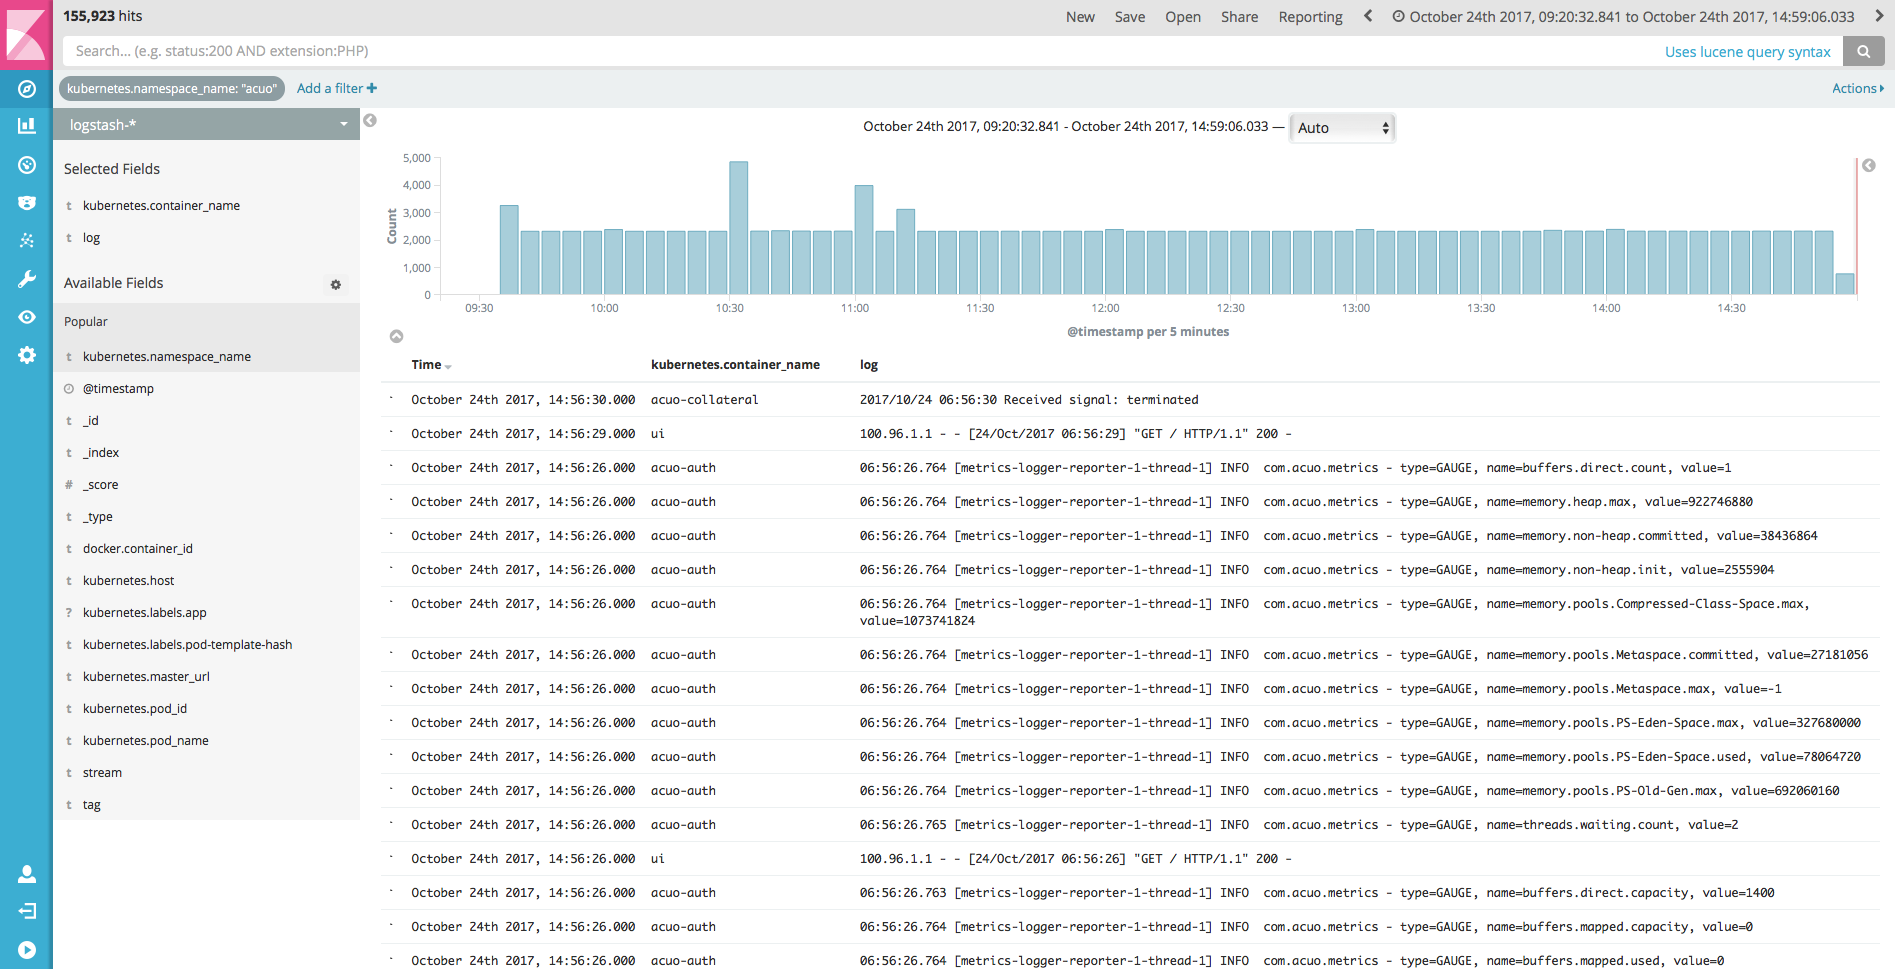
Centralized logging
It is important that before going into production we setup centralized logging of pods/containers running in kubernetes. Pods/containers are running in different kubernetes nodes, scaling up and down, it is hard to understand what is going on without centralized logging. What we want is a single place to look logs from stdout and stderr streams of running containers to quickly detect and diagnose issues.
We run fluentd as daemonsets on every kubernetes nodes. In kubernetes, all containers write their stdout/stderr streams to the /var/log/containers/ folders. Fluentd can be configured to monitor this folder and then send logs into elasticsearch.
Monitoring
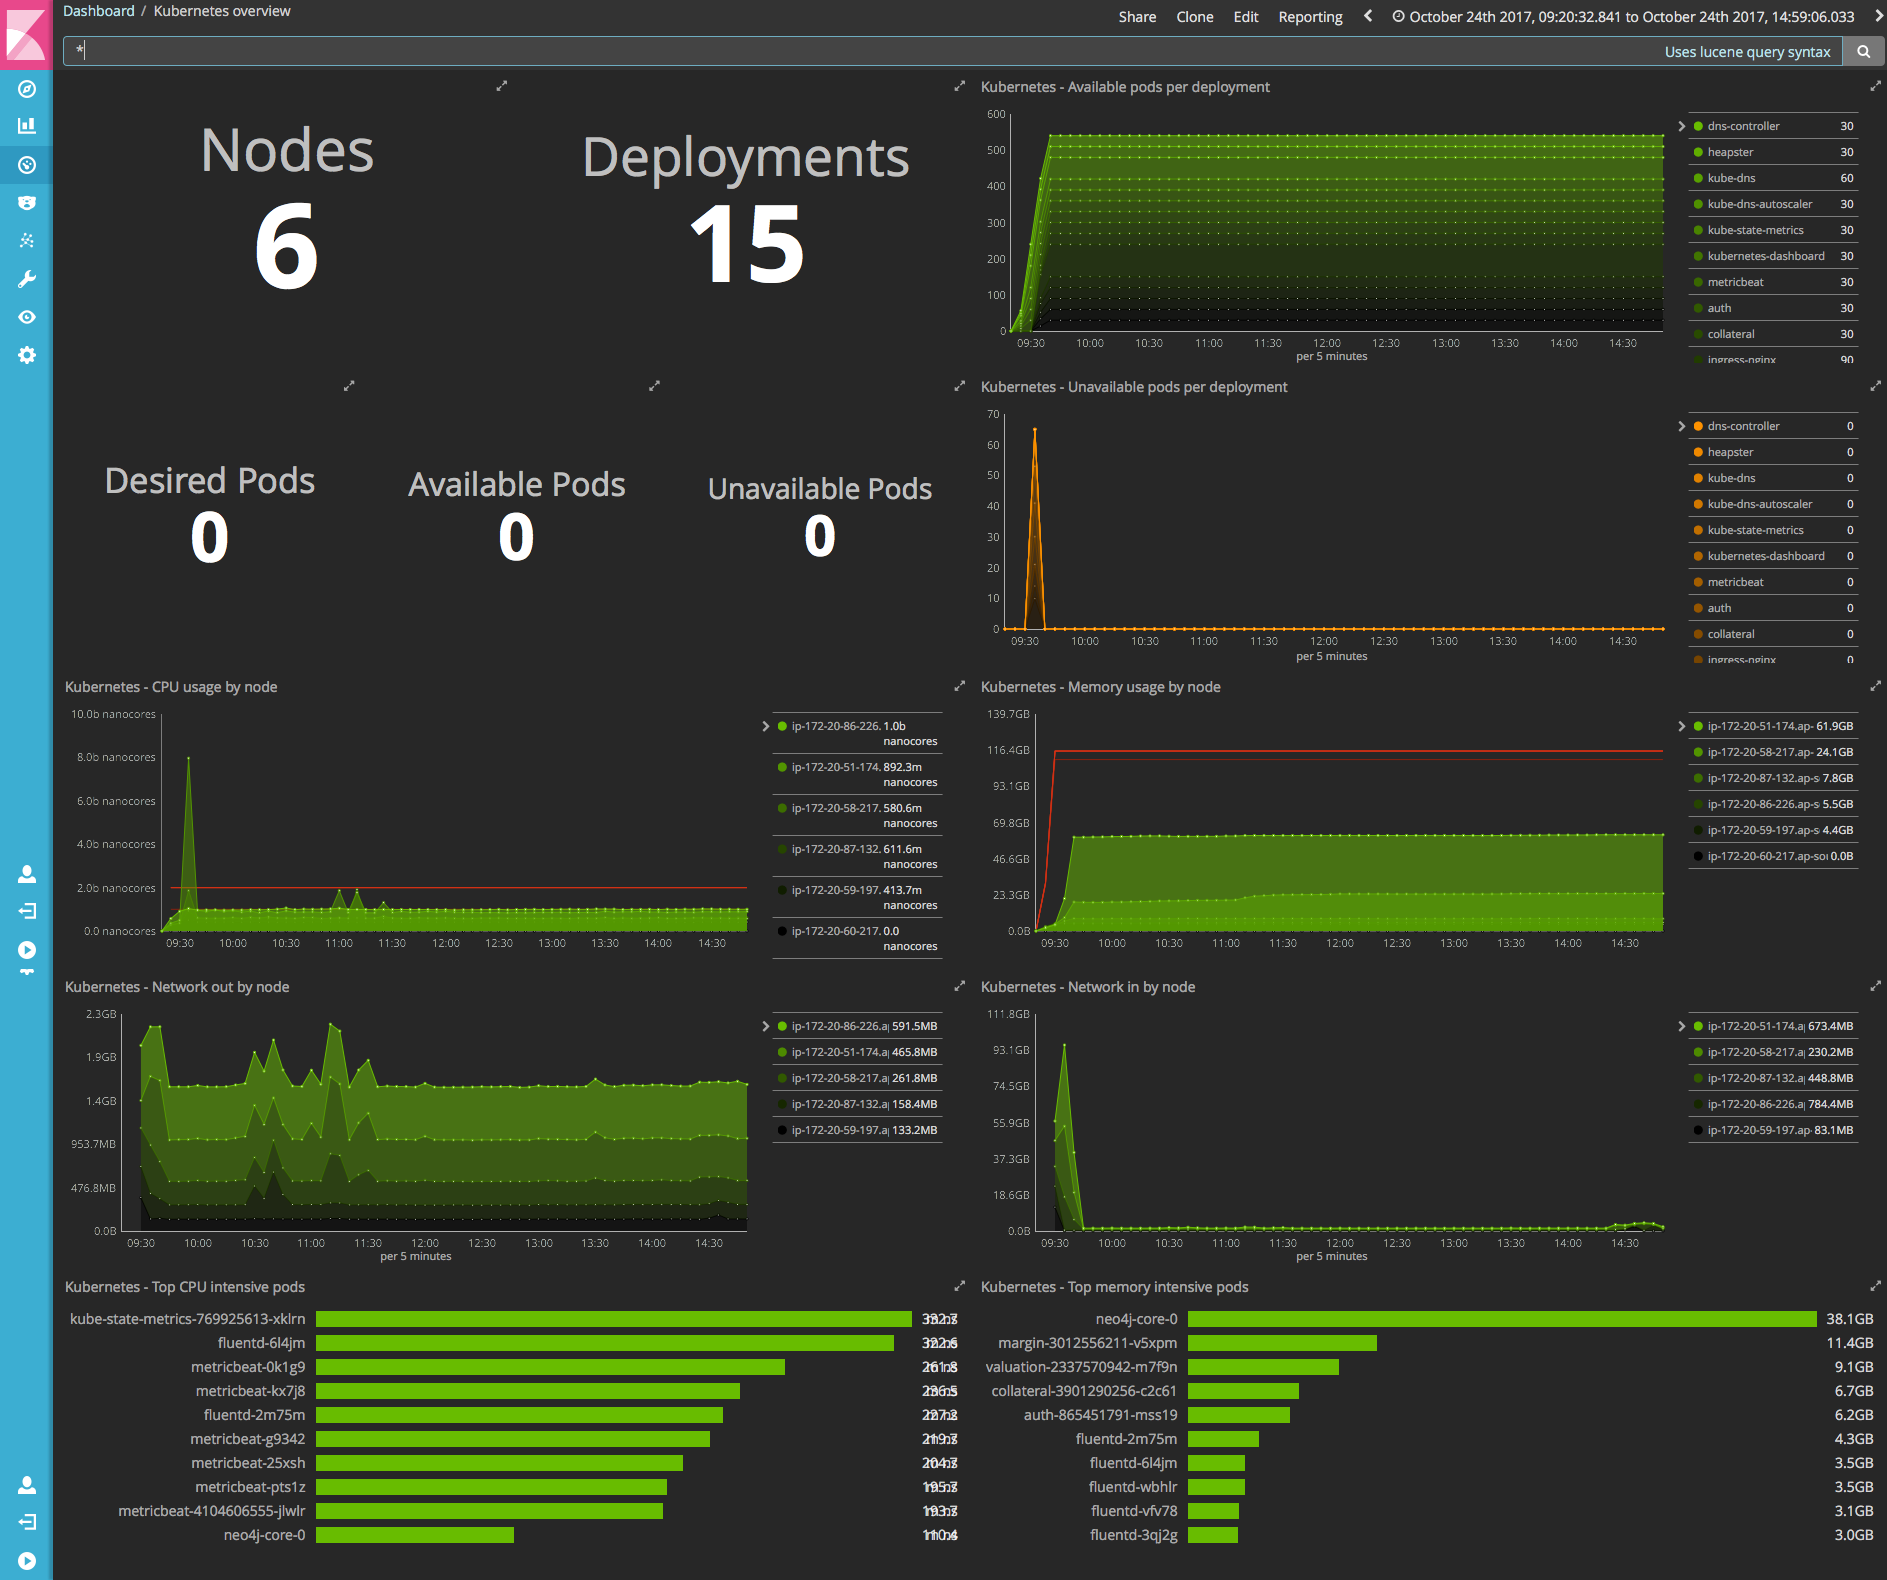
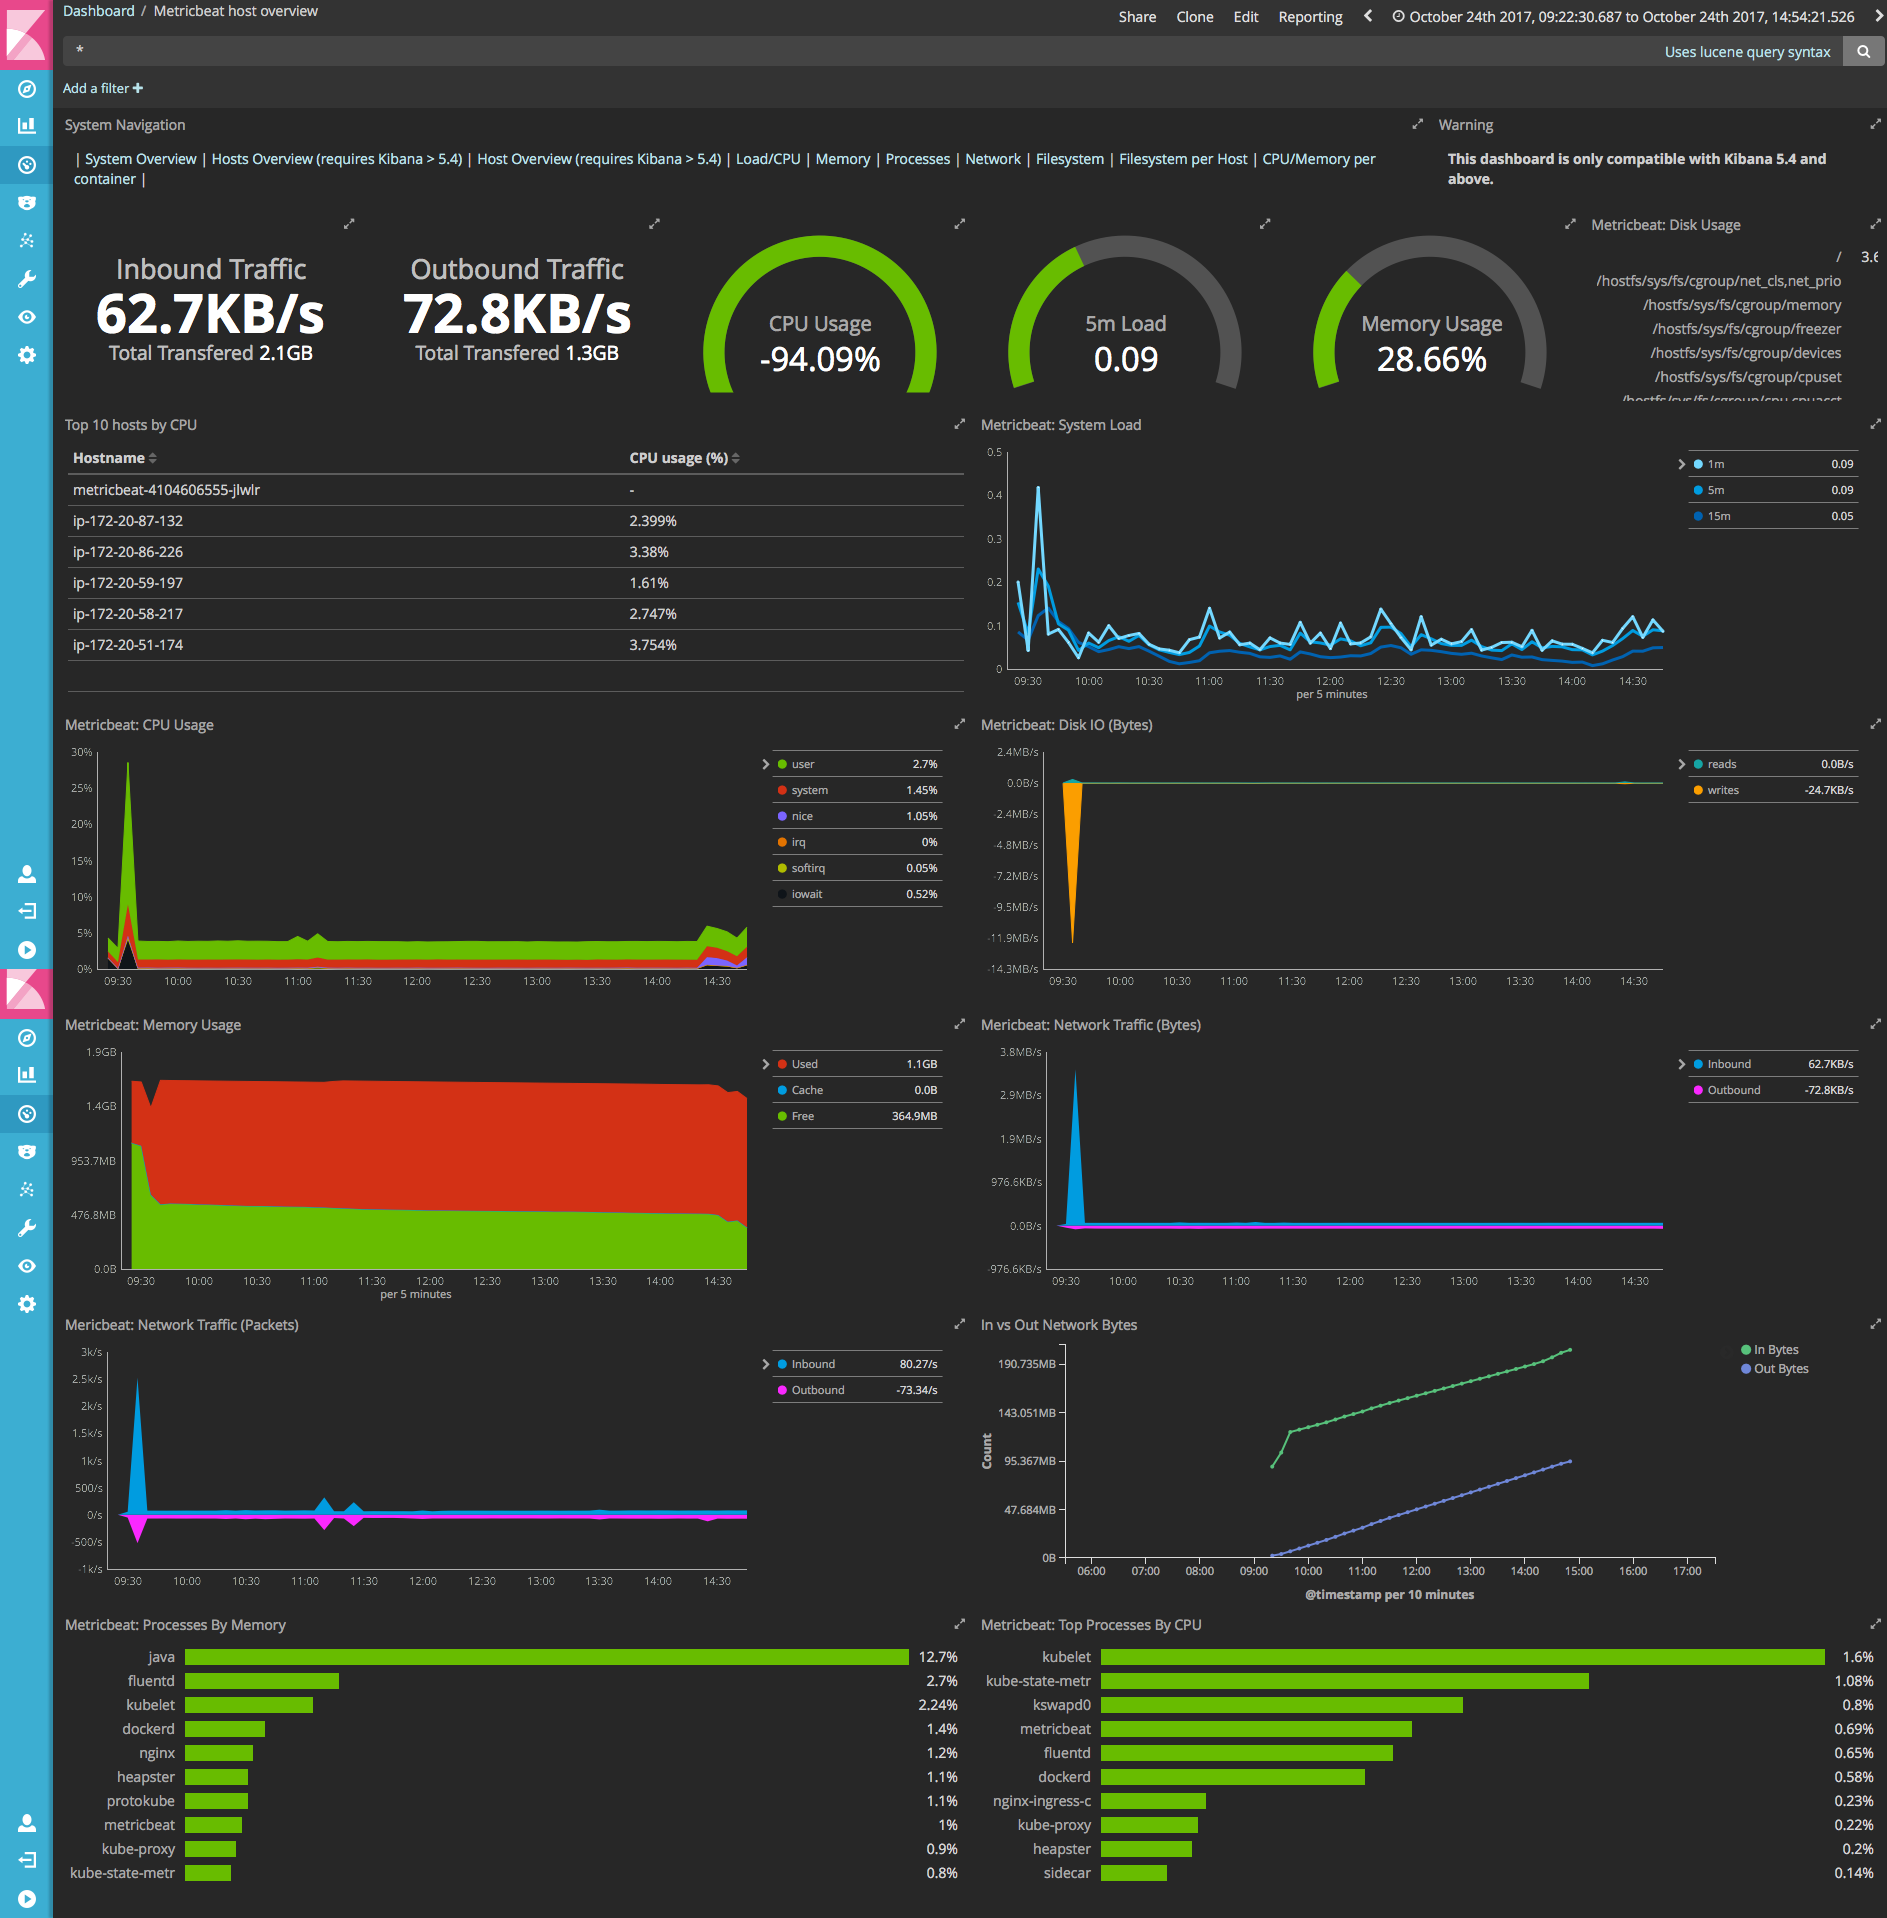
Monitoring is done using metricbeat and kube-state-metric. kube-state-metric is a simple service that listens to the Kubernetes API server and generates metrics about the state of the objects. Metricbeat grab data from kube-state-metric into elasticsearch.
Kubernetes dashboard in kibana:
Metricbeat dashboard in kibana:
Conclusion
Centralized logging and monitoring is important to setup before moving to production with kubernetes. I have created an example kubernetes github repo that contains the kubernetes yaml files to deploy everything we discussed.