Prometheus And Consul For Monitoring Dynamic Services
Prometheus is a tool/database that is used for monitoring. Prometheus adopt a pull based model in getting metrics data by querying each targets defined in its configuration.
Consul is a service discovery tool by hashicorp, it allows services/virtual machines to be registered to it and then provide dns and http interfaces to query on the state of the registered services/virtual machines.
Dynamic monitoring targets
By default, the targets ( nodes to monitor ) are provided statically in the prometheus config file. Static targets are simple when we know in advance our infrastructure.
Traditionally, when we want to monitor all our infrastructure, we simply have to add all ip adresses/dns of our virtual machines. Before the cloud era, this is acceptable because we rarely change our infrastructure. We had fix dev/test/staging/production virtual machines and they dont change often.
With modern devops, infrastructure comes and goes in seconds. When we leveraging cloud provider to dynamically provison ec2 instances, how can we then register these new instances to be monitored under prometheus?
One good solution is using consul to provide targets for prometheus to monitor dynamically!
All nodes provisioned will register with a consul server. When the nodes are de provisioned, consul’s serfHealthCheck will fail.
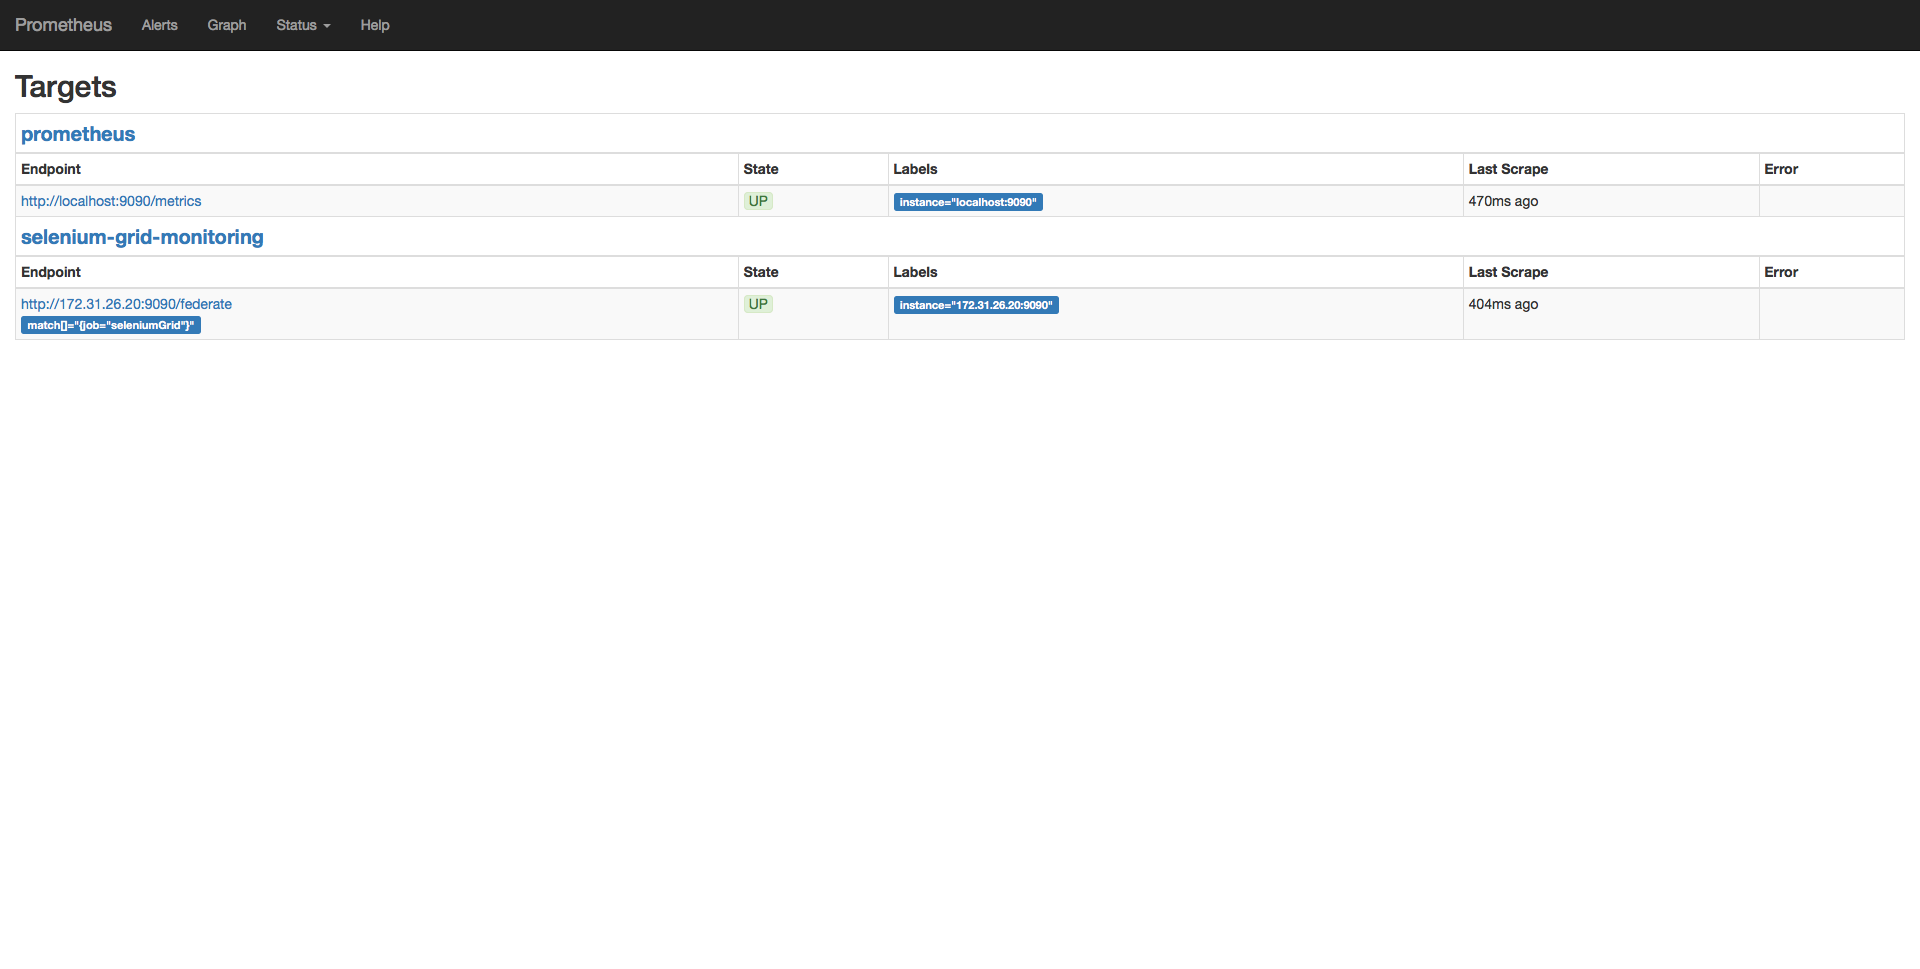
In prometheus, we need to configure it use consul_sd_targets. Prometheus will then query consul http interface for the catalog of targets to monitor.
Consul
consul agent -server -ui -bootstrap-expect=1 -client=0.0.0.0 -bind=0.0.0.0 -data-dir=./consul_data -node=consul_master --enable-script-checks=true
Prometheus Federation
Using Prometheus Federation, in my setup, I am using a root level prometheus server that pulls from child level prometheus server.
The child prometheus server monitor a group of static targets and register itself to consul.
Prometheus configuration (Root)
global:
  scrape_interval:     1s # Set the scrape interval to every 15 seconds. Default is every 1 minute.
  evaluation_interval: 1s # Evaluate rules every 15 seconds. The default is every 1 minute.

scrape_configs:
- job_name: 'selenium-grid-monitoring'

honor_labels: true
metrics_path: '/federate'

params:
    'match[]':
    - '{job="seleniumGrid"}'

consul_sd_configs:
- server:   'localhost:8500'
    services:
    ["selenium-hub"]

relabel_configs:
- source_labels: ['__meta_consul_address']
    separator: ';'
    target_label:  '__address__'
    replacement: '${1}:9090'
    action: 'replace'

- job_name: 'prometheus'

static_configs:
    - targets: ['localhost:9090']
Prometheus configuration (Child)
global:
  scrape_interval: 1s

  external_labels:
    runId: ""

scrape_configs:
  # The job name is added as a label `job=<job_name>` to any timeseries scraped from this config.
  - job_name: "seleniumGrid"

    # Override the global default and scrape targets from this job every 5 seconds.
    scrape_interval: 1s

    static_configs:
      - targets: ["xxx.xxx.xxx.xxx:9182"]
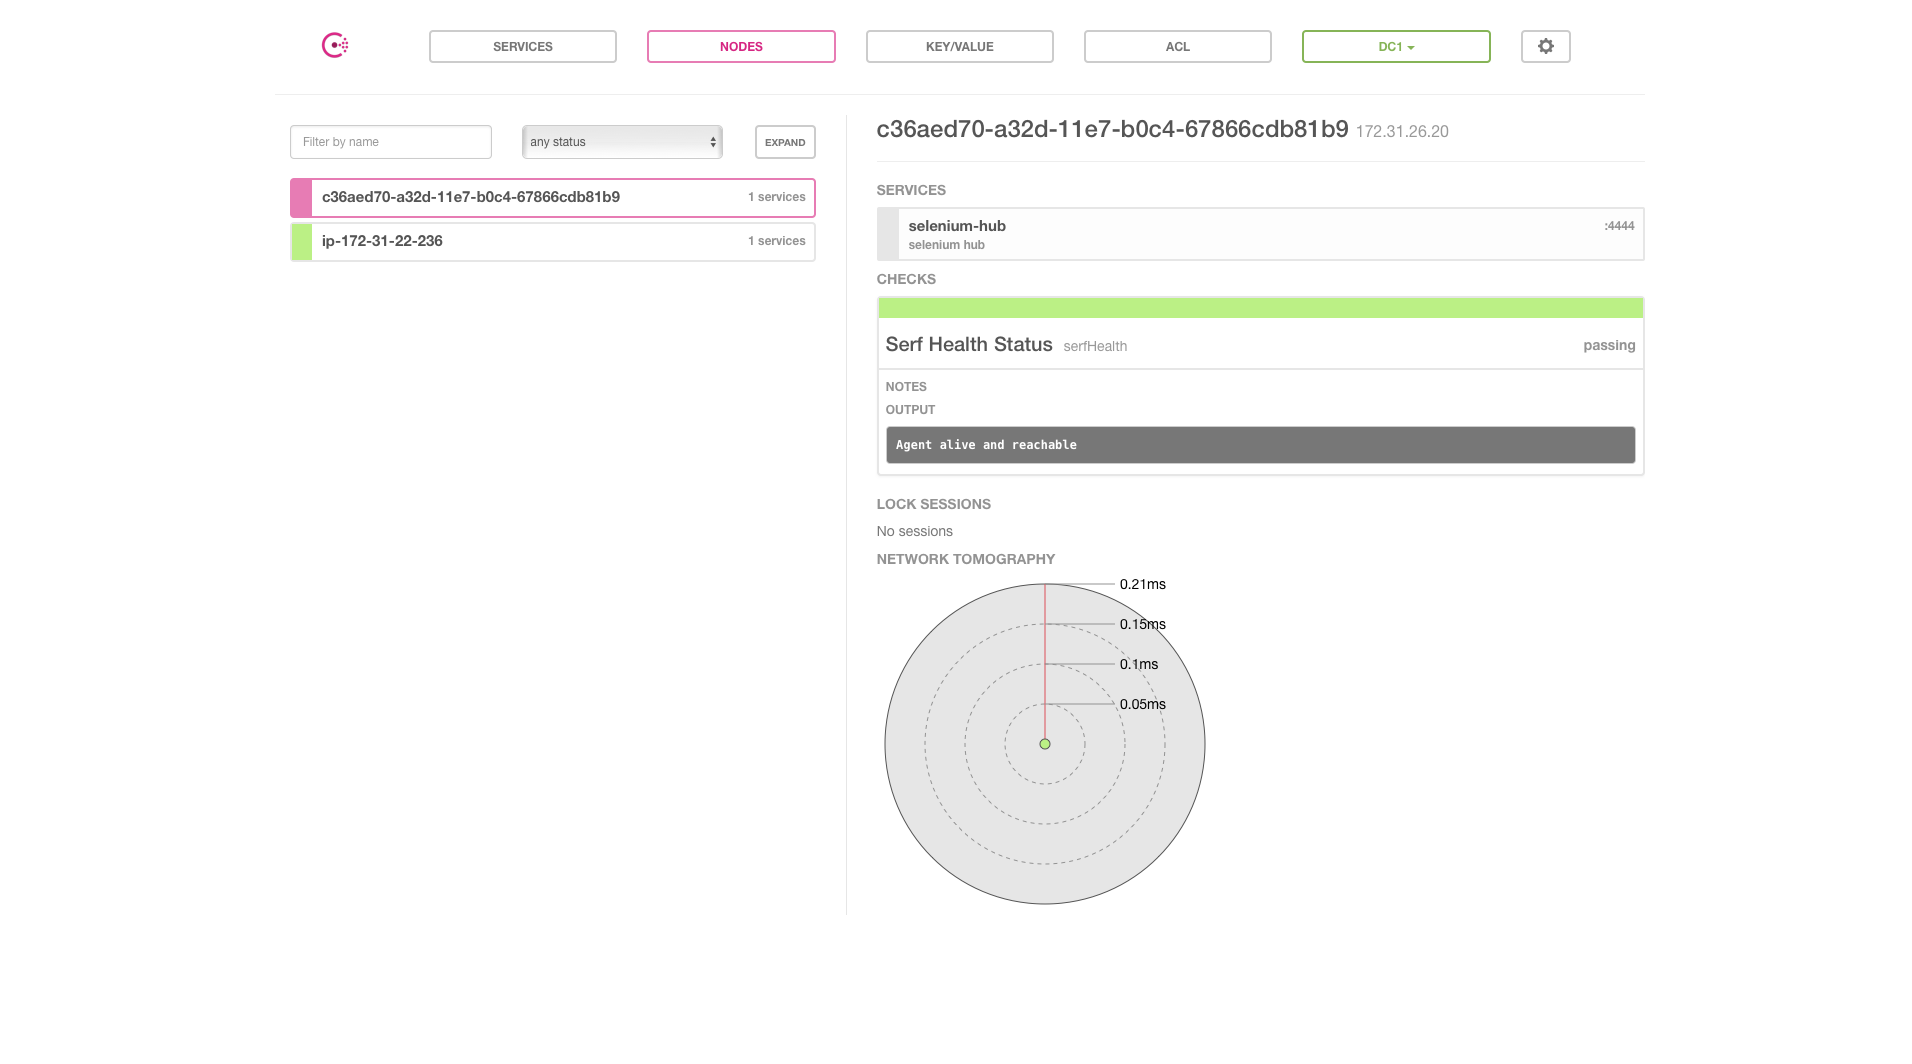
Whenever, we provisioned a node in the cloud, we run consul client and join it to the consul cluster.
Once a node joined, we see the node showing up in consul ui. Consul monitor the node using serfHealthCheck.

Prometheus picking up the targets to monitor from consul:

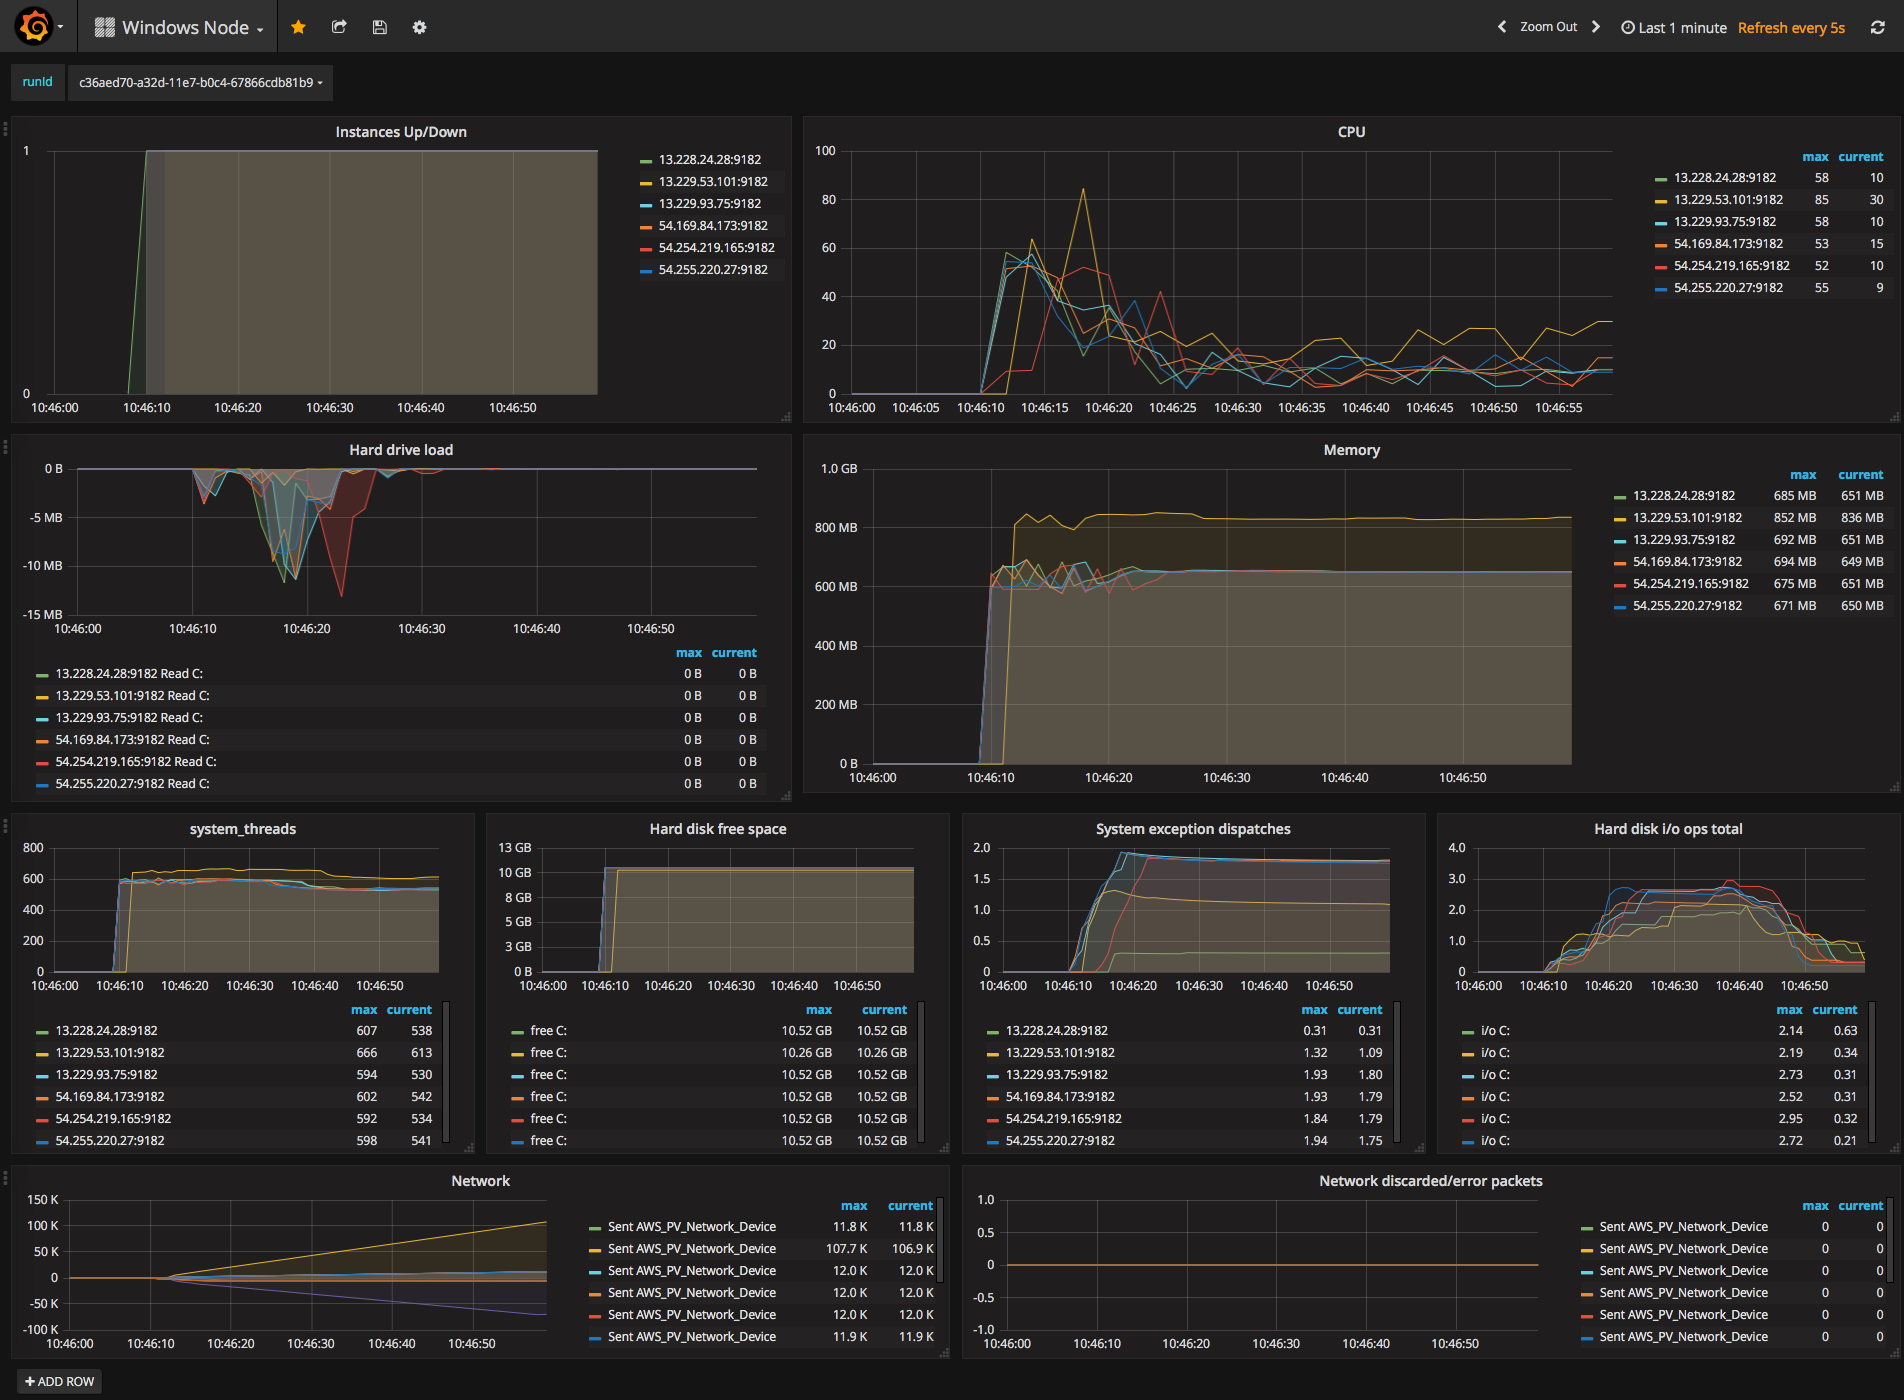
Grafana charting data from prometheus:

Conclusion
Using prometheus and consul service discovery i was able to monitor dynamic infrastructure.
