
Advanced Dotnet Debugging Of Production Apps
In my experience as a software architect, i have used several tools to help debug production .NET applications.
Windows debugger, procdump, procexp, perview and performance counters and perfmon are invaluable tools that help diagnose production performance issues.
Collecting memory dumps and using Windows Debugger (WINDBG) is a lesser known and advanced debugging techniques for .NET Applications running in productions.
Collection of memory dumps can done manually, or invoked directly in code. Procdump can collect dump programmatically. Sysinternals process explorer can take dump with the correct bitness. (x86, x64)
WinDBG ( Windows Debugger )
SOS -> Son of strike. -> .NET extensions for WinDBG.
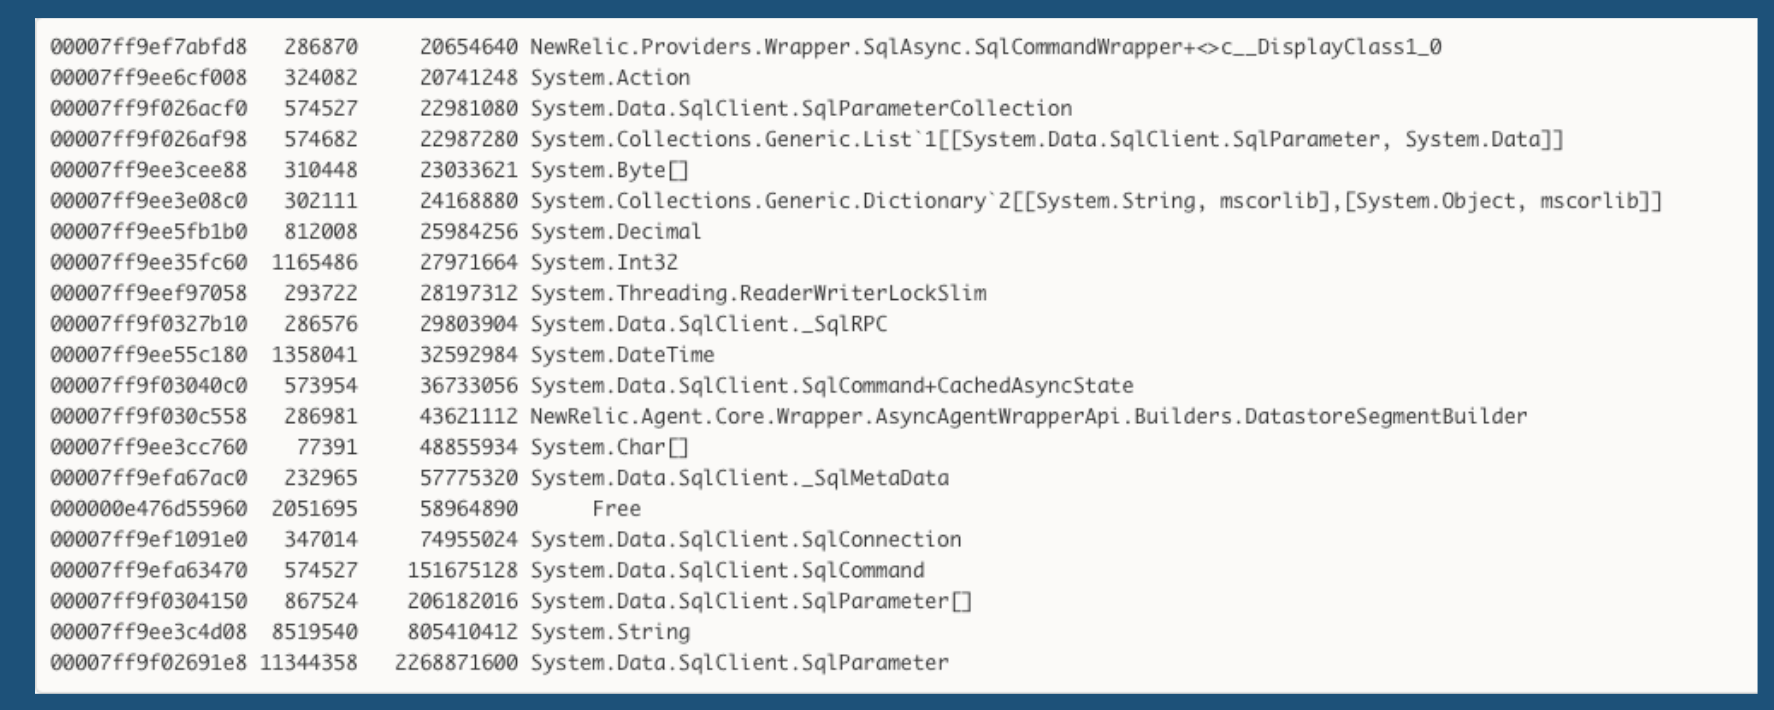
Run !dumpheap -stat will show what are the .net types with most memory allocated on the heap.
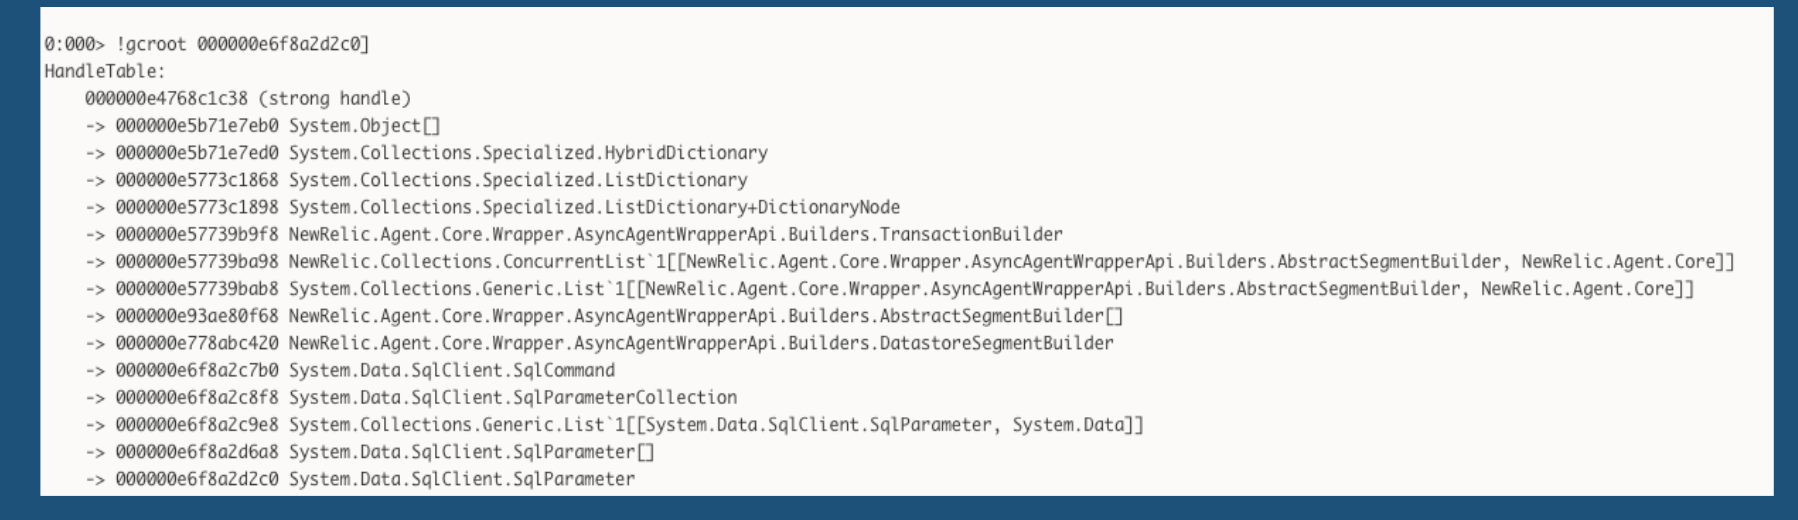
Then run !gcroot
Dump Heap
Analyzing the heap
GC Roots
Analyzing gc roots
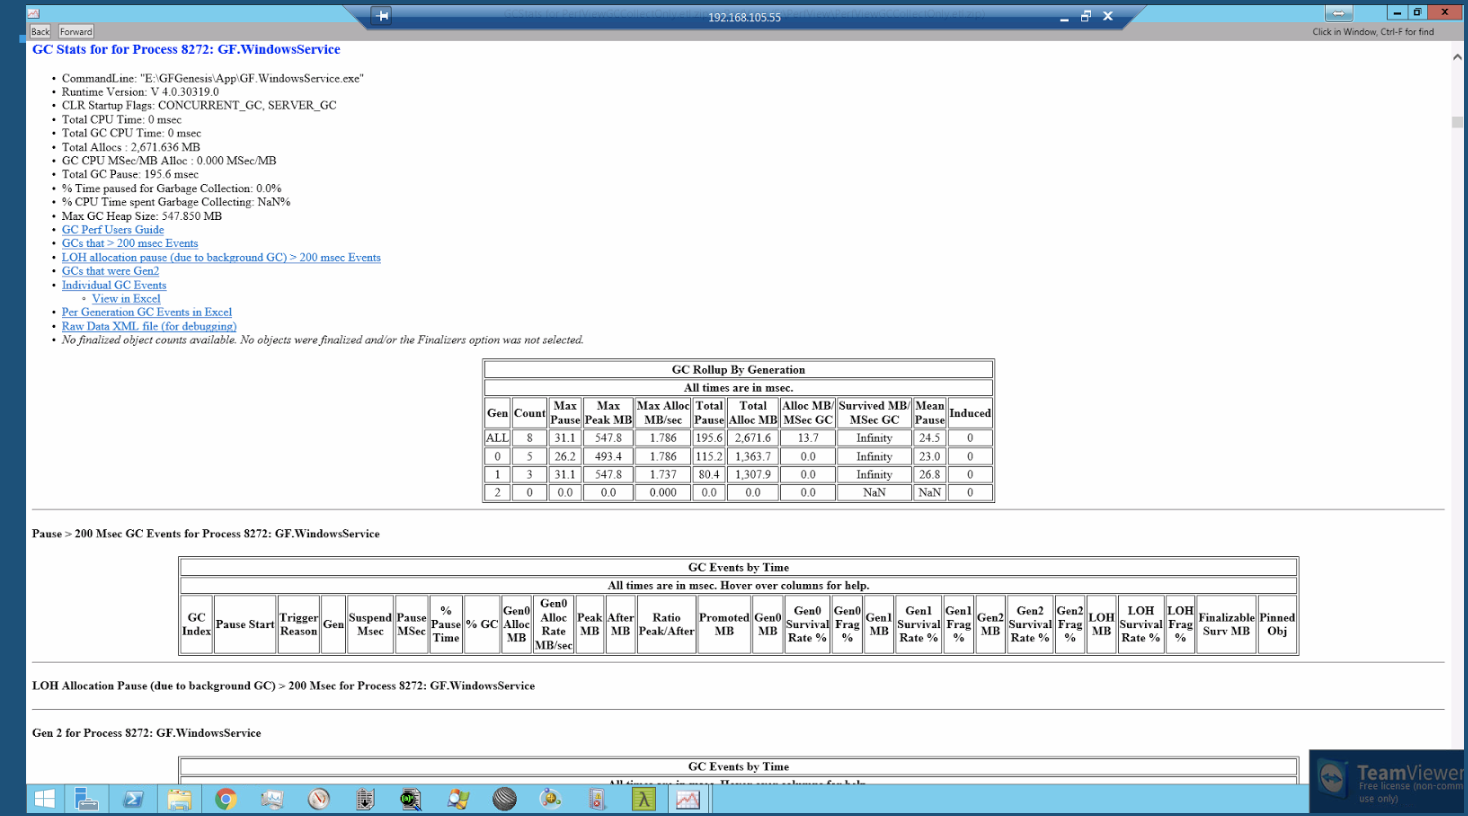
PerfView
PerfView is another powerful tools for .NET apps. In this example below, i used PerfView to collect GC statistics of a Production .NET app.
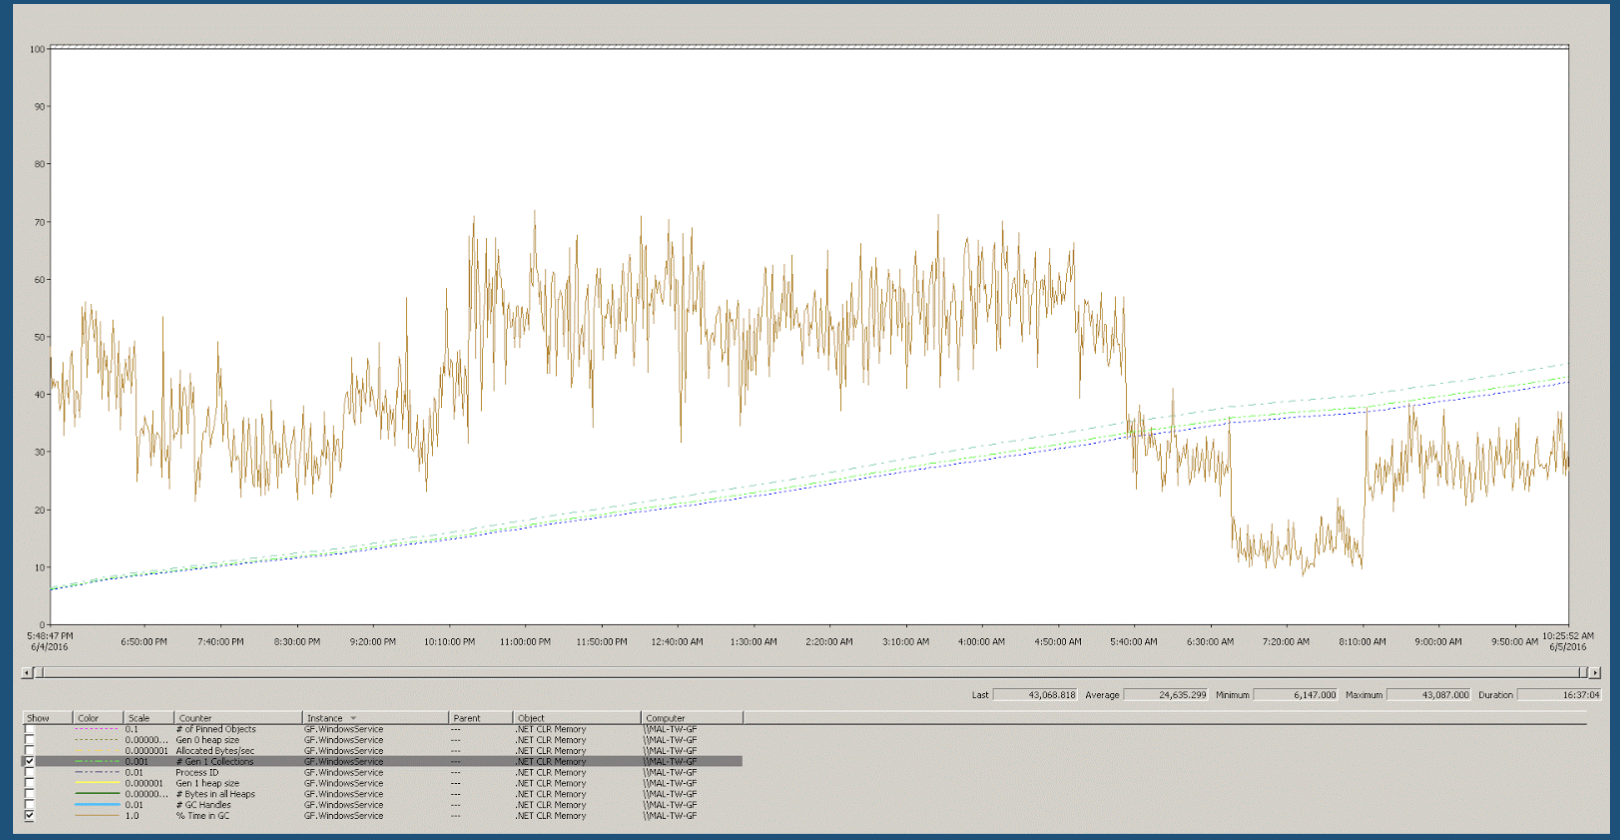
Performance Counter
Provide useful stats emitted by the CLR and more. For example, I found out that one of our windows service was having up to 70% time in GC. 70 % of CPU cycles was used in garbage collections.
Conclusion
Leverage these tools to help troubleshoot pesky production issues on the windows .net platform.