
Monitoring With Elk
I have been leveraging ELK for monitoring various production workloads. Recently, I used the elastic stack to monitor our internal private cloud; openstack. ELK is a all in 1 solution for log centralization, monitoring and analytics.
In this blog post, i would like to share my understanding on the following topics:
- What is the ELK stack?
- Common use cases
- Types of data
- Commercial alternatives
- Openstack Monitoring with ELK
- Elasticsearch
- Kibana
- Beats
- Logstash
- Curator
- Elastalert
What is the ELK Stack?
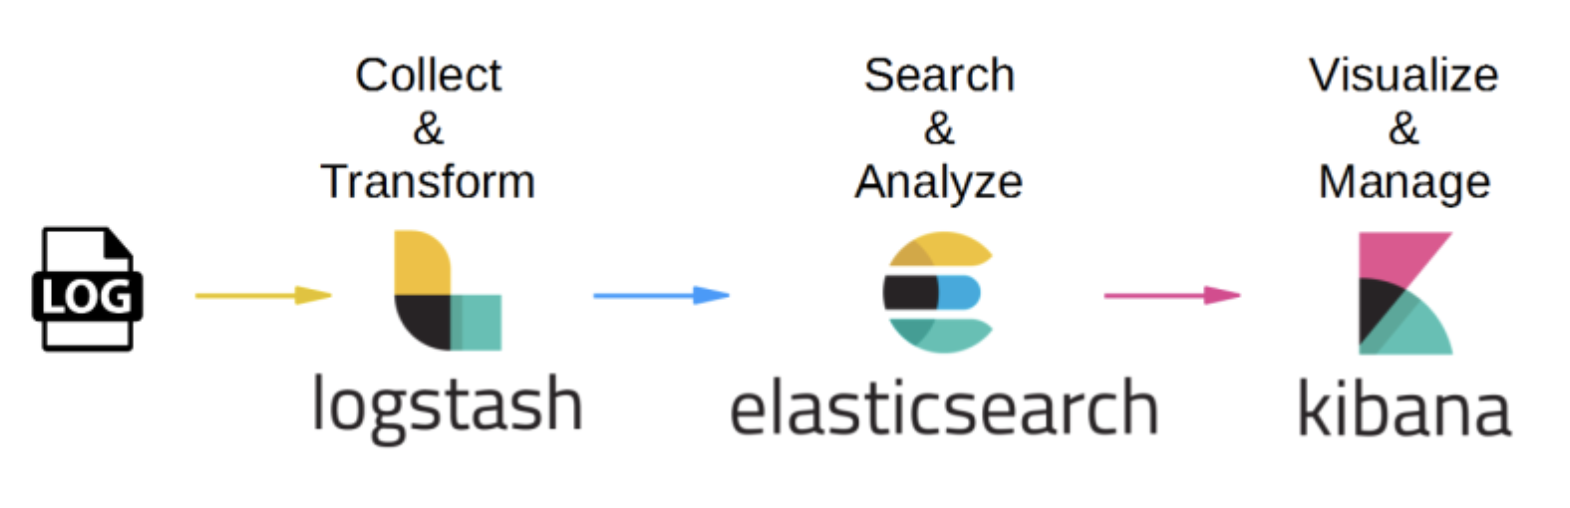
The ELK stack consists of the technologies; Elasticsearch, Logstash, and Kibana. It works very well to provide a centralized logging and monitoring. Elasticsearch is the datastore for the log data. Kibana is the web interface that provide visualization on the data. Logstash sits between log data sources and Elasticsearch, to parse the logs.
Common use cases
ELK is commonly used for the following uses cases:
- Centralized Logging and Log Analysis
- Real time Monitoring
- Full Text Search Engine
- Analytical workloads
ELK can be used to provide centralized logging so that we can aggregrate all the important log files into elasticsearch. The logs can be grok and then store in elasticsearch for querying.
In terms of real time monitoring, Kibana provide ability to create dashboards and then auto refresh them every few seconds. Automated monitoring, can be done using elastalert plugin by yelp, so we can write queries to detect abnormalies, and the fire off notifications to slack/email/pagerduty/etc.
Full text search is mostly used as a complement data store to traditional sql data store. Traditional sql data store are not performant with text querying and its based off loadded to text search engine like elasticsearch.
ELK can provide medium scale analytical workloads because it is designed to be horizontally scalable. Using elasticsearch aggregration queries, a lot of insights can be queried. However, the ingestion of data might not be as performanant compare to other tools.
Types of data
- Machine metrics
- Application metrics
- Business metrics
Machine metrics
- Cpu, memory, swap, network, disk, sockets.
- Heartbeat
- Syslog
- Windows event log, performance counters.
Application metrics
- IO Latencies
- http, redis, sql queries, remote services call.
- services uptime
- redis, sql, web service ping, etc.
- service log
- apache logs, elasticsearch logs, redis logs, etc.
- Distributed tracing
- correlating rpc calls across microservices.
Business metrics
- Things like sales, user behavior, and other product specific information.
- Ship in-band asynchronously using elasticsearch bulk api.
- Ship out-of-band using filebeat/logstash to grok.
Commercial alternatives
There are various commercial alternatives in the market that provide some of the features of ELK.
- Newrelic
- Dynatrace
- Datadog
- Splunk
- Sumologic
Monitoring Openstack with ELK
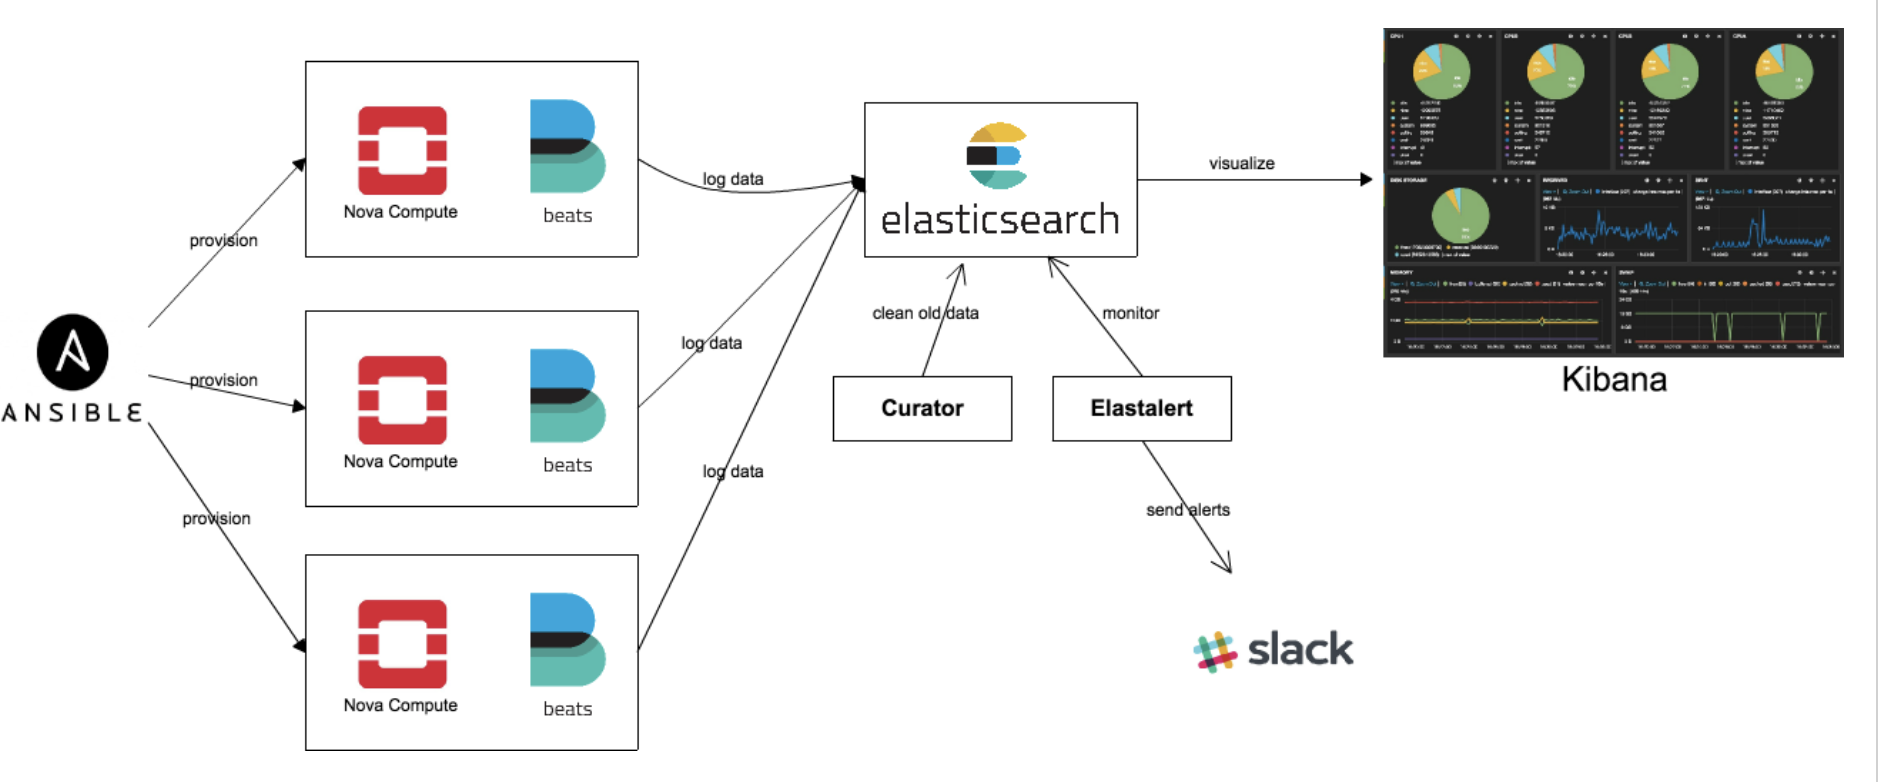
I have used ELK to monitor our private cloud; openstack. Openstack is can be challenging to monitor because it can compose of up to 50 different services running to make openstack work! If any of this services start malfunctioning, administrators has to know and resolve quickly. We use filebeat to monitor important openstack logs and syslog. For, resource monitoring, we use metricbeat.
Components in ELK ( Elastic Stack )
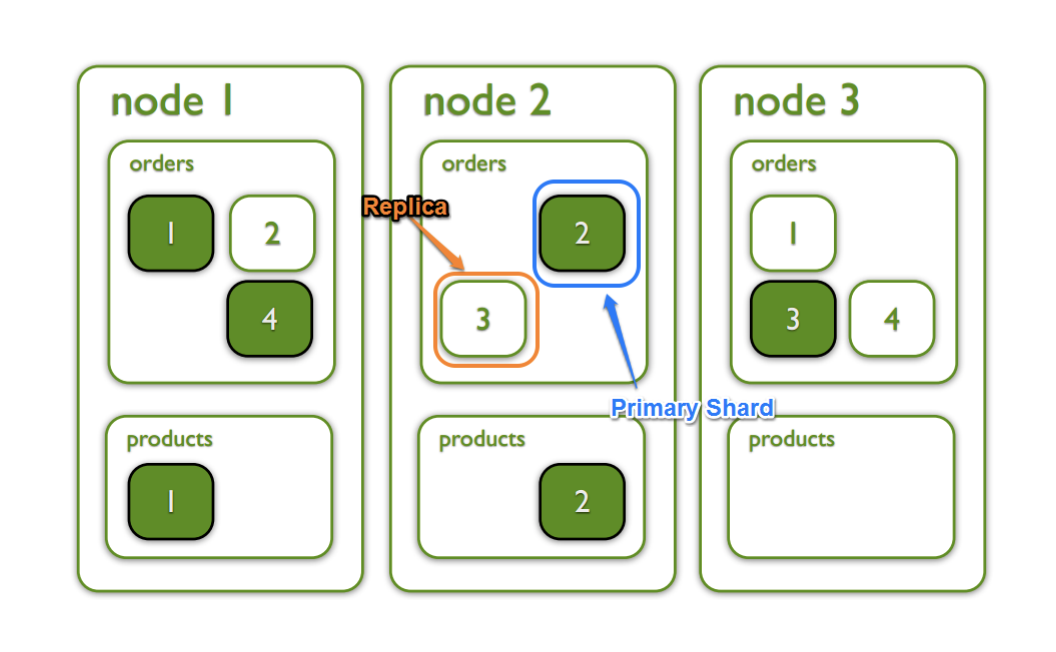
What is elasticsearch?
- Highly scalable distributed json document store.
- Full text search, geo spatial search, advanced search ranking, suggestions, more…
- Easy horizontal scaling.
- Distributed, node discovery, automatic sharding, query distribution, cross index searching.
- REST API for performing actions.
Node roles
- Master - cluster management
- Data - store data, perform queries on shards.
Kibana
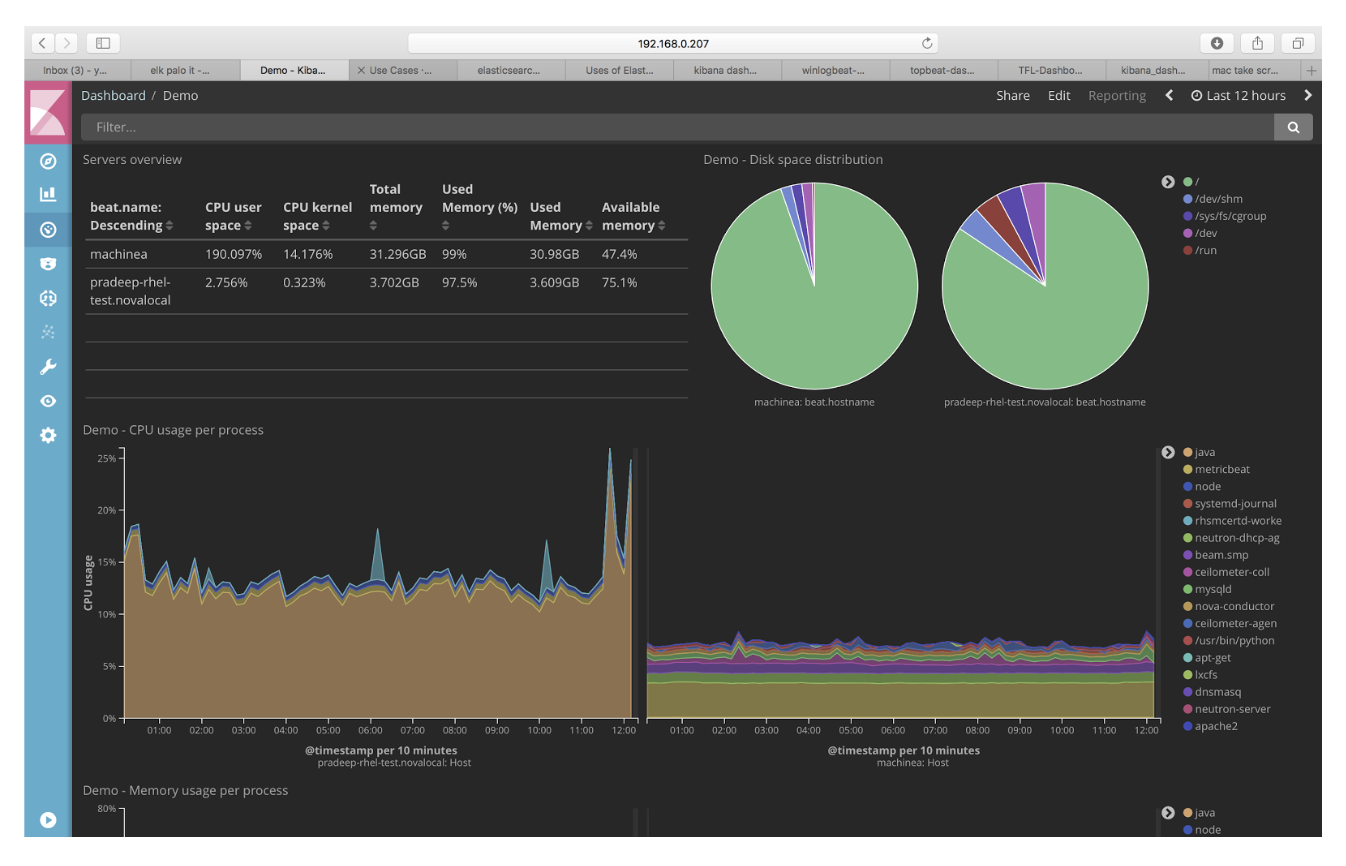
- Web interface.
- Visualize data in elasticsearch.
- Create visualization.
- Build dashboards composed of visualization.
- Timelion
- Machine-learning features.
Beats
Single-purpose data shippers.
- Filebeat: Log files.
- Metricbeat: Collect metrics from System, cpu, memory, disk. From services like Apache, Postgres, Redis, etc.
- Packetbeat: Collect network data.
- Heartbeat: Pings via ICMP, TCP, and HTTP.
Logstash
Inputs -> Filters/Transforms -> Outputs Support multiple inputs, more than just beats. Support multiple outputs, more than just elasticsearch. Input plugins: Beats Kafka Redis SQS Cloudwatch More…
Curator
https://github.com/elastic/curator Opensource python scripts to clean data based on rules. E.g., automatically clean data older than N days to prevent disk space running out.
Elastalert
https://github.com/yelp/elastalert Opensource alerting module. Automated way to providing alerts to slack, pagerduty, email, etc. Detect data anomalies and send alert.
Conclusion
ELK is great for monitoring, centralized logging, analytics. However, resource consumptions can be pretty heavy comparing to alternatives. For example, if you simply needed monitoring & alerts, prometheus & grafana might be a better choice.